From Business Question to Data Question
It all starts with a question from the workplace, such as: “Why are sales declining?” or “How can we get a better grip on capacity?” The answer to these questions comes from collaboration between specialists who work daily in internal processes and data analysts. As a data analyst, you ask the specialists for examples or a sketch: “Show me how you’d like to see it.” Next, you determine which data is needed and how it can be extracted from different systems. This often involves combining data related to various business processes. The challenge is to link data from different source systems.
Collecting Data from Various Sources
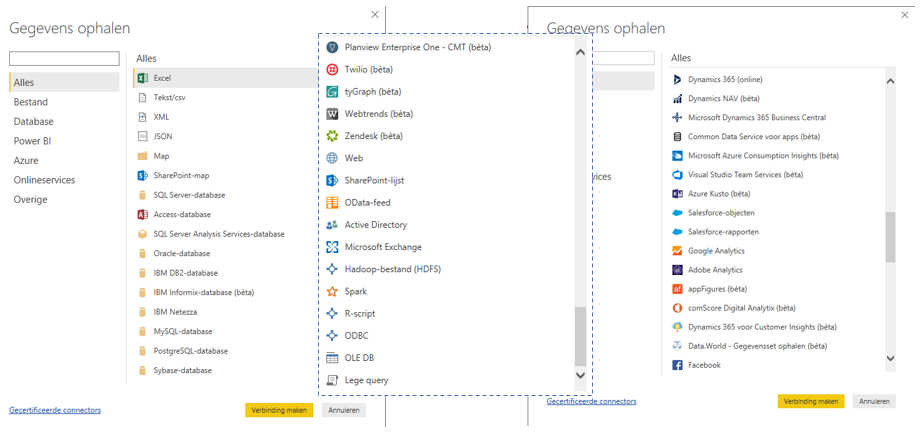
Business specialists and data analysts work together to determine which data to extract from each source and how to relate it. Power BI offers a wide range of built-in connectors that make accessing various data sources easy:

The “Get Data” function in Power BI: Tens of connectors available
- Microsoft Software: Power BI works seamlessly with all of Microsoft’s applications, both On-Premise and in the Cloud, including Office 365, Dynamics 365, Project Online/Server, SharePoint, and Exchange.
- Databases: In addition to Microsoft SQL/Server, Access, and Azure, Power BI has connectors for Oracle, IBM DB2, Sybase, SAP HANA, SAP BW, and Google BigQuery.
- Online Services: This includes Salesforce, Adobe Analytics, Google Analytics, Facebook, Planview, Webtrends, Zendesk, and Teamdesk.
File Types and Data Protocols: If a system can export data to Excel or CSV, Power BI can process it. Power BI also supports formats like XML, OData, JSON, Folder, and PDF.
For systems that do not have a built-in connector in Power BI, there are other solutions available to extract and present data.
Extracting Data Using OData
One of the connectors available for data extraction is an OData feed, which is a widely used open protocol. OData is available in Excel, and connections to Microsoft Dynamics CRM, Project Online/Server, and SharePoint are also made using the OData protocol. Increasingly, public online services, like the Central Bureau of Statistics, offer data based on OData.
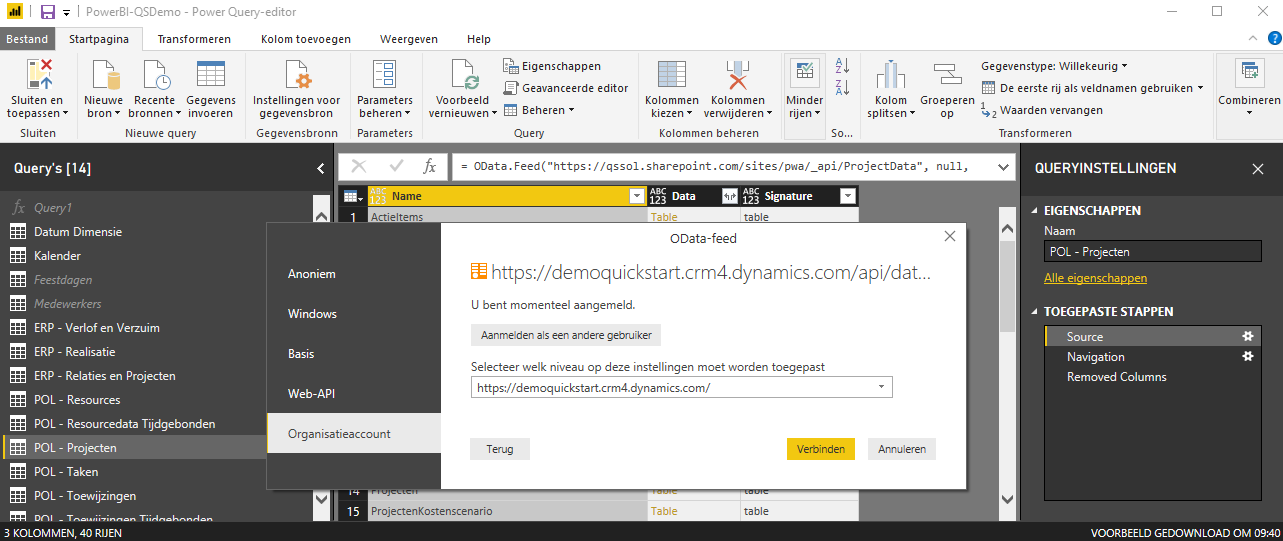
With an OData feed, data is extracted via a URL and imported into Power BI. After entering the correct URL of the data source and any required credentials (login, authorization), the connection to the data source is established.

Connecting to the OData feed
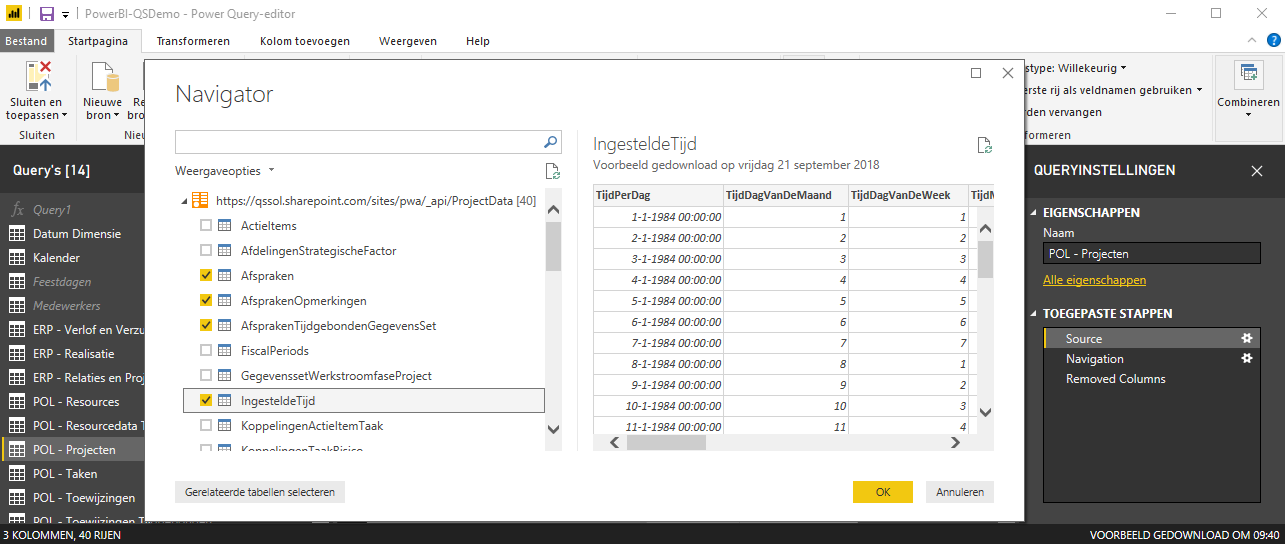
Depending on the data source, the URL entered, and the available data, one or more data objects will be available. A data object is a collection of data, comparable to a table with columns. If multiple data objects are available, you can select which ones to import. After confirming, the selected data objects will be available as tables in Power BI.

Selecting available data objects to be imported
Data Extractions and a Uniform Interface
In Power BI, you keep your original data sources intact. You don’t need to merge or edit the source data from different systems. Instead, you work with data extractions that you use in your reports. One of the significant advantages of Power BI is that it doesn’t matter from which source systems or databases the data is extracted. Once the data is imported into Power BI, each dataset available in table form is accessible in the same way for processing. You can hide columns, manipulate data (e.g., replace empty values with zero), sort rows, and add new columns with calculations.
Modeling Data
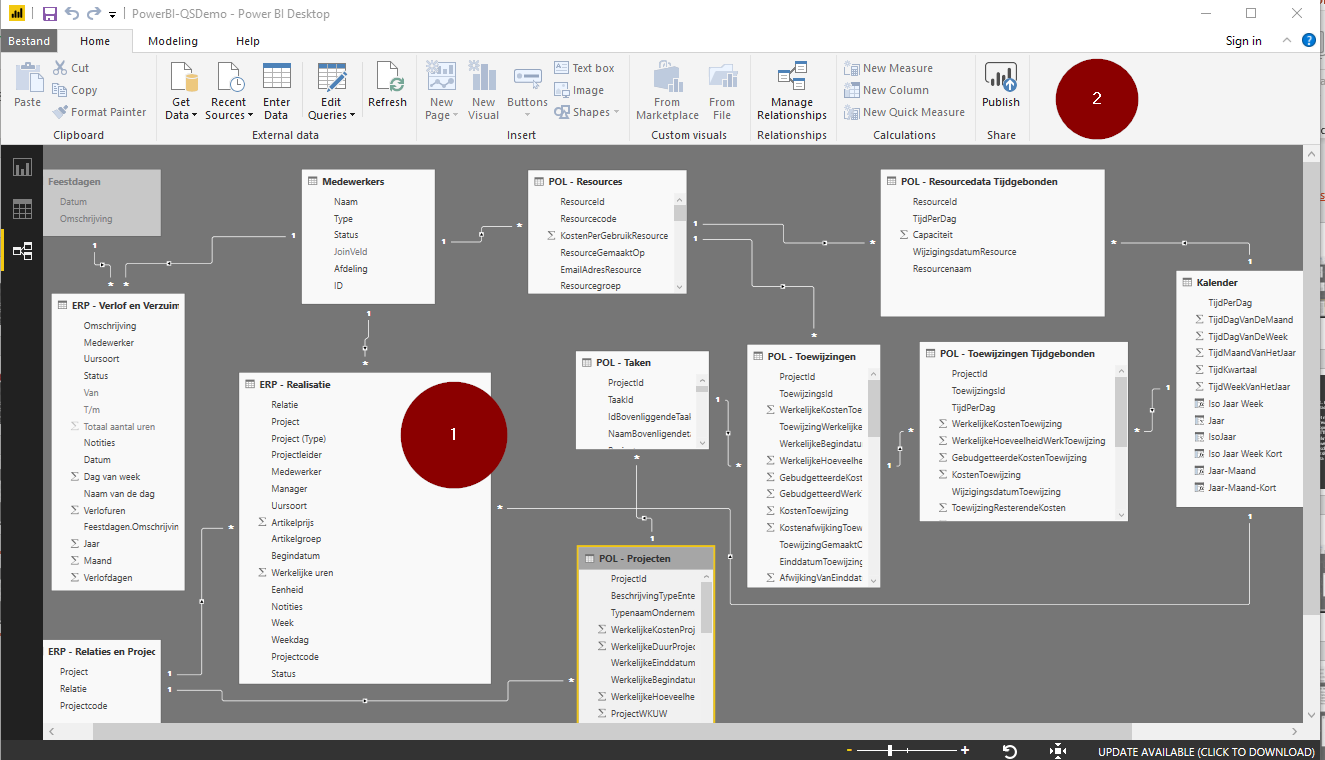
With Power BI, you bring together data from multiple sources and store it in your own data model. You then create relationships between the data using an identifier, such as a customer number, location, or month. By establishing relationships between data, you can answer questions like: “What is the revenue per month for the salespeople at the Apeldoorn branch?” In a future blog, we will delve further into the importance of relating data and securing it so that users only see relevant data.

Here you see various data objects—tables with columns—merged into one data model (1). This model forms the basis for building your reports, which you can make visually appealing and share with others using the Publish button (2).
Creating Valuable Reports Yourself
Power BI is designed for self-service. After connecting the various data sources and processing and modeling the data obtained, users can create their own reports with minimal training. This makes answering business questions accessible, allowing specialists to further develop the solution independently.
The actual creation of reports and dashboards with Power BI, following what has been described so far, will be covered in the next blog. Stay tuned—it’s coming online soon!


