With the standard version of Power BI, you can save unlocked data, models, and reports as a file and optionally print or export them to PDF or Excel. You can also share this file via email or file sharing. However, after every change you make, you will need to manually distribute the report again. Fortunately, there is a smarter method: publishing Power BI reports online with the Publish button.
Power BI Workspaces
As a Power BI user, you get your own workspace on PowerBI.com, called a workspace. Here, you can publish your reports, view them in the browser, analyze and modify them with filters. If you share the report with colleagues, they will see the report in their workspace, provided they have the correct authorization. If they want to update the report with new data, they will also need access to the data sources. Since not everyone should or can have access to reports, specific data, or source systems from which the data is extracted, we recommend that a limited number of people manage the Power BI reports.
Authorizing Reports at the User Level
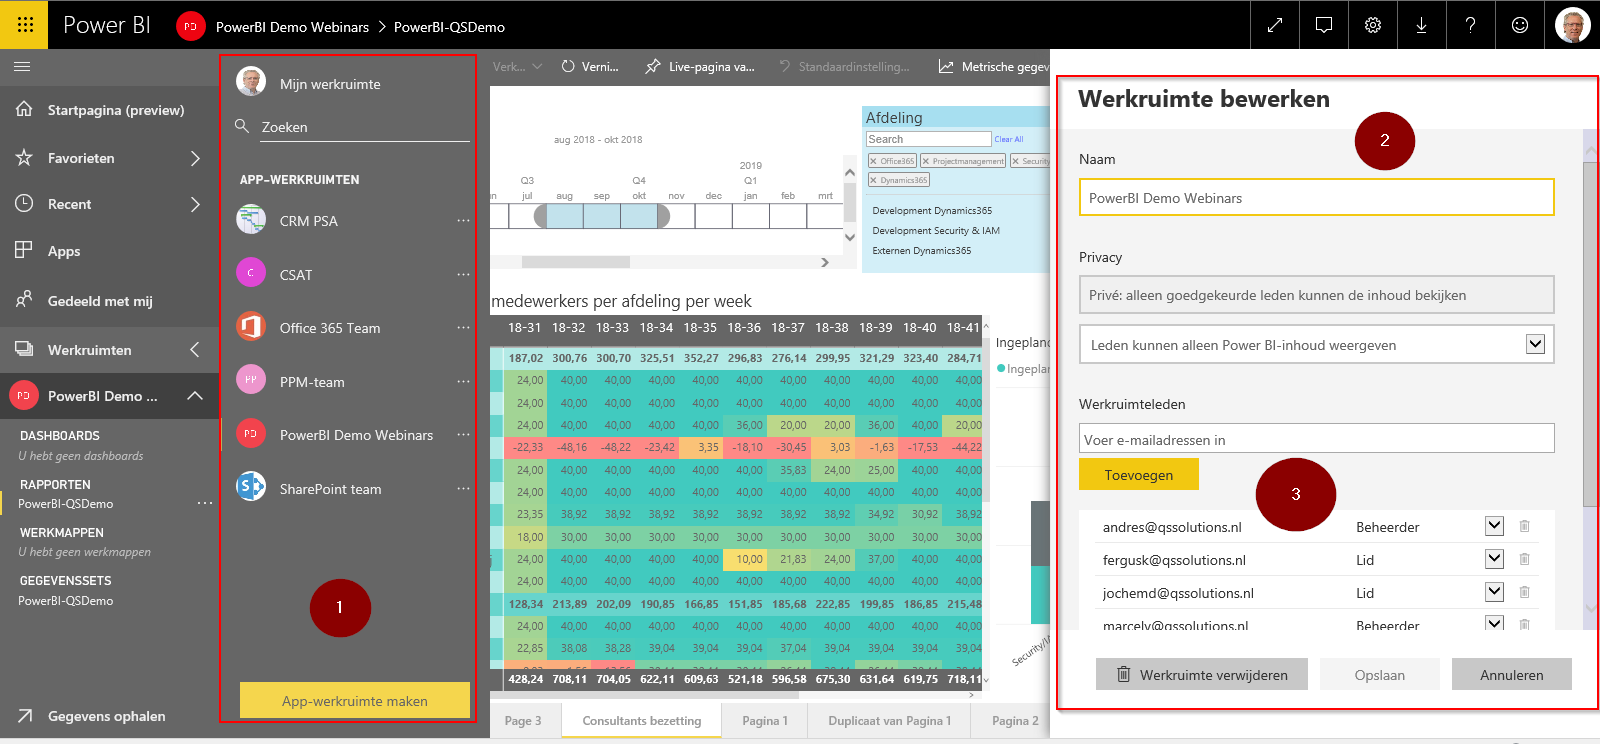
On PowerBI.com, you can define multiple workspaces and link users to them with different rights: View and Edit. When you publish a report, you choose the workspace where the report will be available, and thus for which users. For example, you can create a workspace for the management team or account managers.


Defining Workspaces:
- Here are all the available workspaces.
- Edit the name and privacy per workspace.
- Add members’ email addresses to the workspace.
To work with other workspaces beyond the standard private workspace and to share reports, you need the more advanced version of Power BI: Power BI Pro.
With a Power BI Pro license, you effectively link the user structure of Office 365 to Power BI. This allows you to easily select different user groups within the organization for publication. Each user belongs to a role or category, such as a salesperson or sales manager. By publishing Power BI reports to workspaces, you can set access for specific users or groups to your report per workspace and category. Additionally, Power BI Pro also offers a higher frequency for automatic data refreshes in your reports.
* Behalve gebruikers (email adressen) kunnen ook gebruikersgroepen (Active Directory, gedefinieerde
netwerkgroepen, ADFS) aan werkruimten worden gekoppeld. Vereiste hiervoor is wel dat de
gebruikersgroep een e-mailadres heeft.
Data Authorization at the Row Level: Row Level Security
When you don’t want employees to see each other’s data, such as sales figures, you could create and share different reports through workspaces. But if you have, for example, twelve branches or thirty representatives, each with their own set of reports, and you want to make changes to the report, you would need to make that change twelve or thirty times. A more efficient approach is to create a single report in which you make the data available per role or specific user so that each user sees only their own – accessible only to them – data within the same report. That’s exactly what Row Level Security (RLS) in Power BI does.
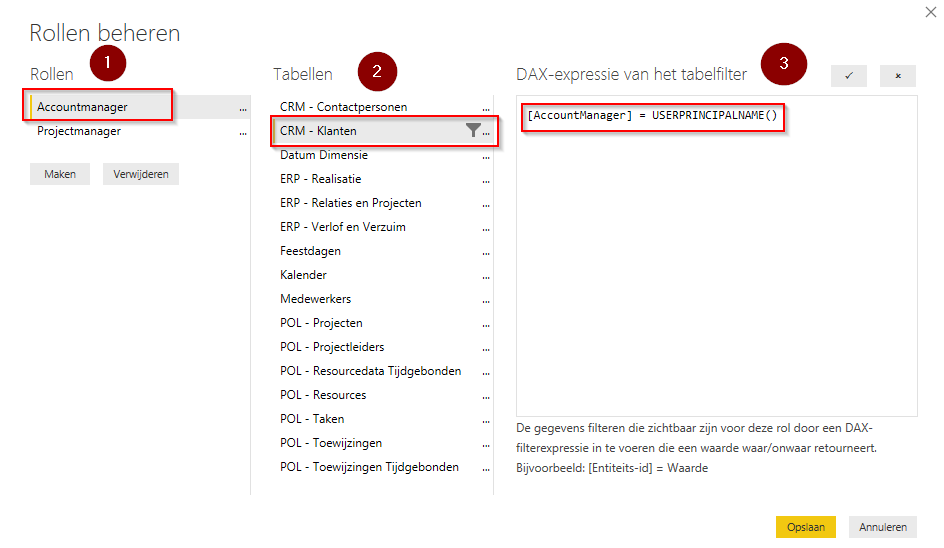
For instance, in the Customer Sales Data report, as an account manager, you may only see the sales data for your customers. With RLS in Power BI Desktop, you add a filter to the Account Managers table for the defined role “Account Manager”. For example, a regional manager may see the sales data for all account managers in a specific region. In Power BI Desktop, you can define a role “Regional Manager” with a filter on a table of regional data, where the name of the regional manager is recorded for each region. You can create relationships between tables, such as linking the region table with the account managers’ data table by region. This way, you determine which data is available per role: an account manager only sees their customers’ data, and a regional manager sees the data for their account managers.

- Define the Role: Start by defining the role (e.g., “Sales Manager” or “Regional Manager”).
- Select the Table(s): Choose the relevant table(s) that contain the data you want to filter.
- Create the Formula: For each selected table, create the formula that will filter the data based on the role.
Static and Dynamic Row Level Security
You can configure data authorization for Power BI users either statically or dynamically.
Static RLS: This involves defining roles per region (e.g., North, Central, South). For each role, you apply a filter to the region table that is specific to that role. Finally, you assign specific users to the appropriate role.
Example of Static RLS:
- Suppose there are three regions: North, Central, and South.
- Each salesperson operates in a specific region, and every customer is associated with a region based on their address.
- You define a role for each region (e.g., North, Central, South), set the appropriate filter for each role in the region table (Region = North / Central / South), and link the region table to the customer data table and sales data table.
- Then, you assign the correct employees to the corresponding role.
- This ensures that each employee sees only the relevant data based on their assigned role.
- The static nature of this setup means that roles, filters, and employee assignments must be maintained regularly. If a new region is added or the region structure changes, you must update this in Power BI. Similarly, any changes in employee assignments (e.g., someone changes regions or leaves the company) must be kept up to date in Power BI.
- Dynamic RLS: This approach simplifies the process by using a single role and assigning users to that role. The role’s filter refers to the current username or other attributes specific to the user. For example, a user with a management function may see more data than someone in the same role without management responsibilities. The data must be tagged accordingly to indicate whether it is available only to managers or others as well.
Another example is a table with employees in which a specific field indicates which (other) employee (in the same table) is the manager of the employee. Using DAX functions in Power BI (DAX is the formula language used in Power BI, among others), it is possible, depending on who the currently logged-in user in Power BI is, to display only data for their own employees, in accordance with the organizational structure. Changes in the organizational structure, once available again in Power BI, automatically have a direct effect on the data available to users.
Maintaining Control Over Your Data
Power BI offers a wide range of options for combining and visualizing data. By incorporating not only data from the data sources but also user data from the organization into your data model, you can authorize data down to the row level based on roles. This approach ensures that you maintain control over your data and deliver business insights to the right people within your organization.


